In this lesson plan, your learner will delve into "using difference to compare data." They'll enhance their skills in subtraction and data analysis by working with pictograms and bar charts. Through engaging activities, your learner will learn to interpret and compare data effectively, making math both practical and enjoyable.
Here are the main ideas covered in this lesson plan:
Difference as Subtraction: Understanding how to use subtraction to find the difference between two values in data comparison. For example, "15 - 12 = 3 shows the difference between 15 and 12."
Graphical Representations: Using pictograms and bar charts to visualize data differences. For example, "A bar chart showing the difference in the number of apples and oranges."
Interpreting Data: Recognizing how to compare larger and smaller values using subtraction in questions like "How many more?" and "How many fewer?" For example, "Essie has 6 sweets and Asif has 7; the difference is 7 - 6 = 1."
Teaching Plan
The activities in this lesson plan will help your learner to confidently compare data using difference and subtraction.
Examples and visuals to support the lesson:
1. Revisiting Difference as Subtraction
Begin by revisiting the concept of difference as subtraction and apply it to various contexts. For example: "John has twelve crayons and Sarah has fifteen crayons. How many more crayons does Sarah have than John?"
When encountering "How many more...?" type questions, encourage your learner to practice thinking in terms of difference and recording as subtraction. For example: If moving from 12 to 15, initially they may record as addition (12 + 3 = 15), but also practice recording as subtraction (15 - 12 = 3).
You can also use visual aids like bar models and number lines to help your learner visualize the difference between the quantities.
Skill Check
I can answer "how many more" questions by finding the difference between numbers.
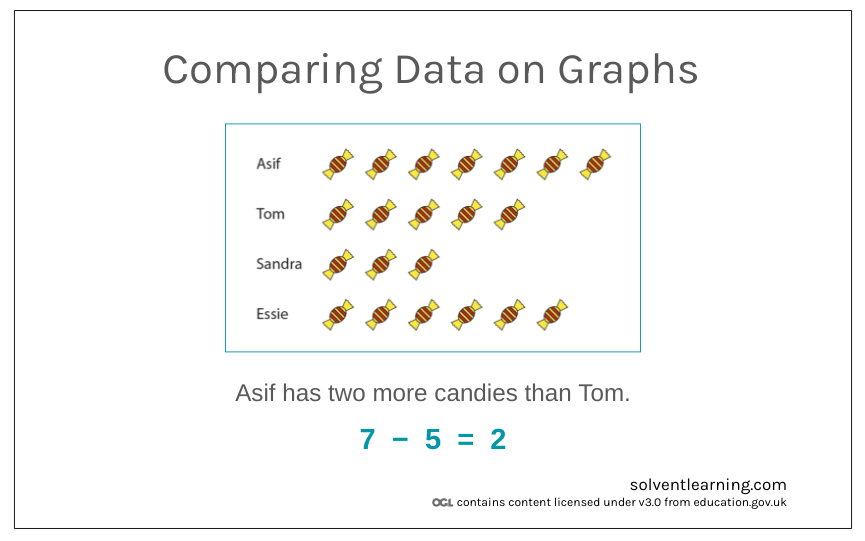
2. Using Pictograms to Compare Data
Use pictograms to help your learner progress from pictorial to abstract graphical representations. Encourage them to see the difference in values and record it as subtraction.
Present questions that compare smaller and larger amounts. For example: "How many fewer sweets does Essie have than Asif?" Essie has 6 sweets, and Asif has 7. The calculation is written as 7 - 6 = 1.
Encourage your learner to design their own difference questions based on given pictograms to promote deeper understanding.
Skill Check
I can use pictograms to answer questions about how many more and how many fewer.
3. Comparing with Bar Charts
Once comfortable with pictograms, introduce bar charts as a more abstract representation.
Ask questions such as: "How many more apples are there than oranges? How many fewer pencils are there than erasers? What is the difference between the number of red and blue balls?"
Encourage your learner to write their answers as subtraction calculations. For example: "There are 10 apples and 7 oranges. The difference is 10 - 7 = 3."
Skill Check
I can use bar charts to answer questions about how many more and how many fewer.
4. Providing Further Challenges
Introduce pictograms where icons represent multiple objects to highlight the importance of representing problems as subtraction rather than just using visual differences.
For example, if one icon represents 5 objects, and there are 3 icons for one category and 4 for another, the difference should be calculated considering the value each icon represents.
Summary
By the end of this lesson plan, your learner will confidently use subtraction to compare data in various contexts. They'll be adept at interpreting pictograms and bar charts, identifying differences, and applying their math skills to real-world scenarios, making math both practical and fun.